Data Analysis & Visualisation
- Recent Projects -
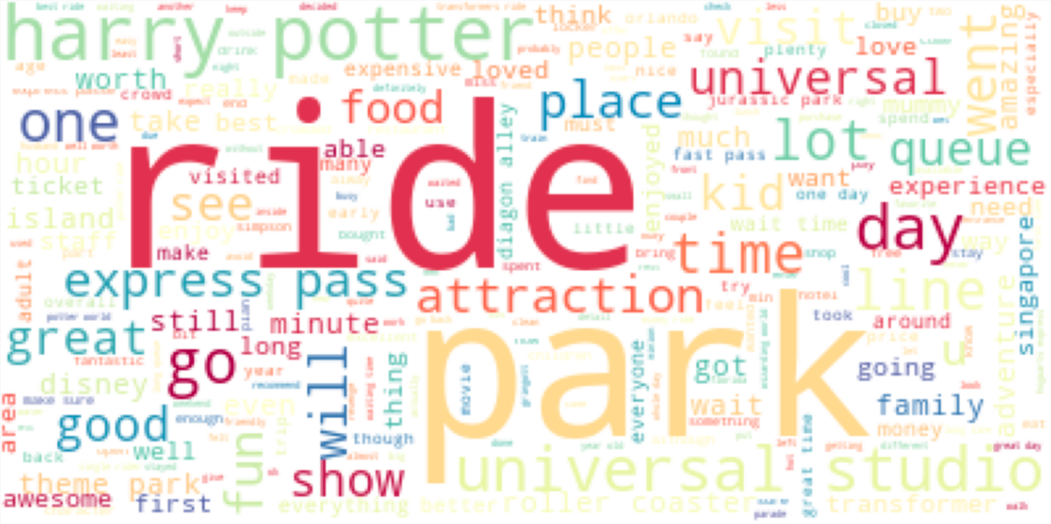
Universal Studio Review
The dataset that I scraped can be used as a reference for you. For example, here I do an analysis of the data using Named Entitiy Recognition (NER) from Spacy. I do a supervised learning for clustering sentiment analysis.
Tools used :
Python, pandas, re, TextBlob, Spacy.
Category :
Analysis, visualisasi, EDA
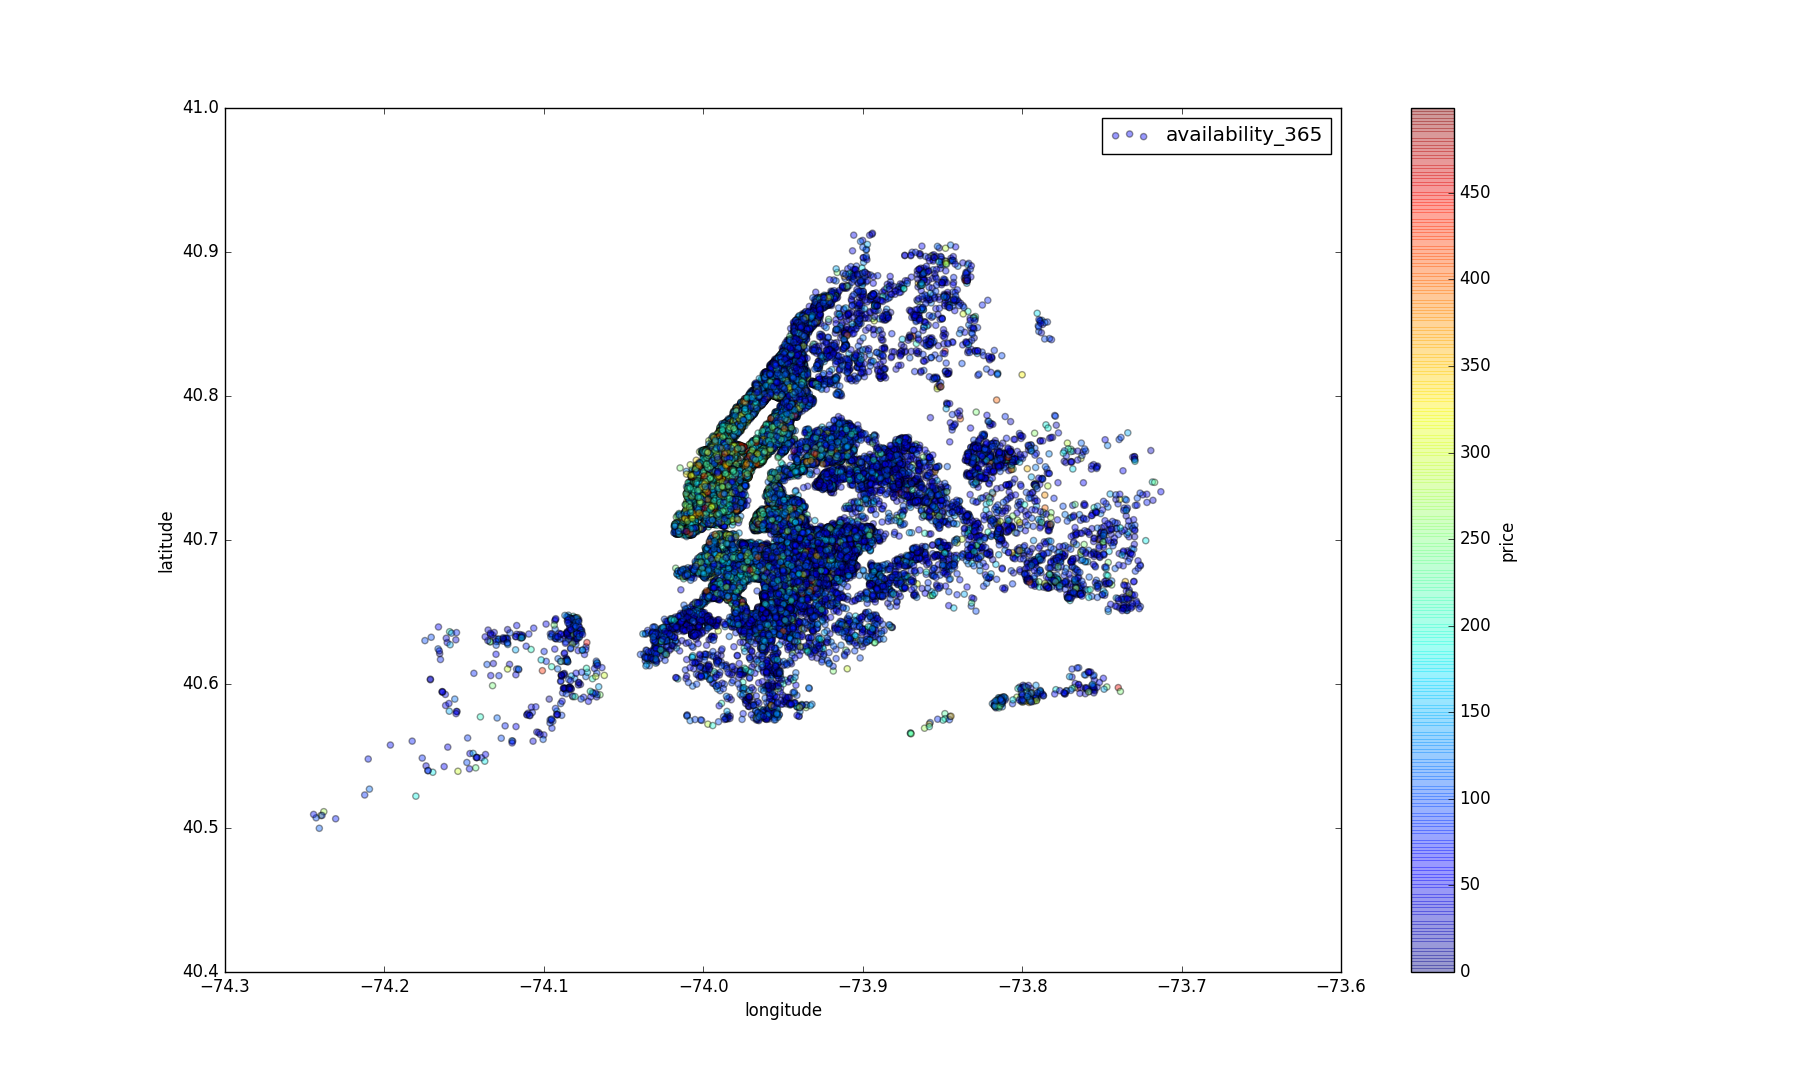
Uber New York Data Analysis
Analysis and visualization of the Uber New York Data obtained from Kaggle.
Tools used :
Python, pandas, numpy, matplotlib, seaborn
Category :
Analysis, visualisasi, EDA

Netflix Movies and TV Shows — Exploratory Data Analysis (EDA) and Visualization Using Python
Analysis and visualization of the Netflix data obtained from Kaggle.
Tools used :
Python, pandas, numpy, matplotlib, seaborn
Category :
Analysis, visualisasi, EDA

Python Exploratory Data Analysis (EDA) on NYC Airbnb
Exploratory data analysis of New York Airbnb open data. Visualisation using piechart, barchart, histogram, boxplot. Analytic using correlation to predict the price.
Tools used :
Python, Numpy, Pandas, Matplotlib, Seaborn,
Category :
Statistics, EDA, Linear Regression, Visualisation
COVID19-API.org Data Exploration and Visualizing Using Python
Dig up covid19 timeseries data from one of the available open fires using Python. Scraping data from API to analysis and visualisation.
Tools used :
Python, json, numpy, requests, pandas, matplotlib, datetime
Category :
Scraping, Timeseries, Statistics, EDA, Visualisation.

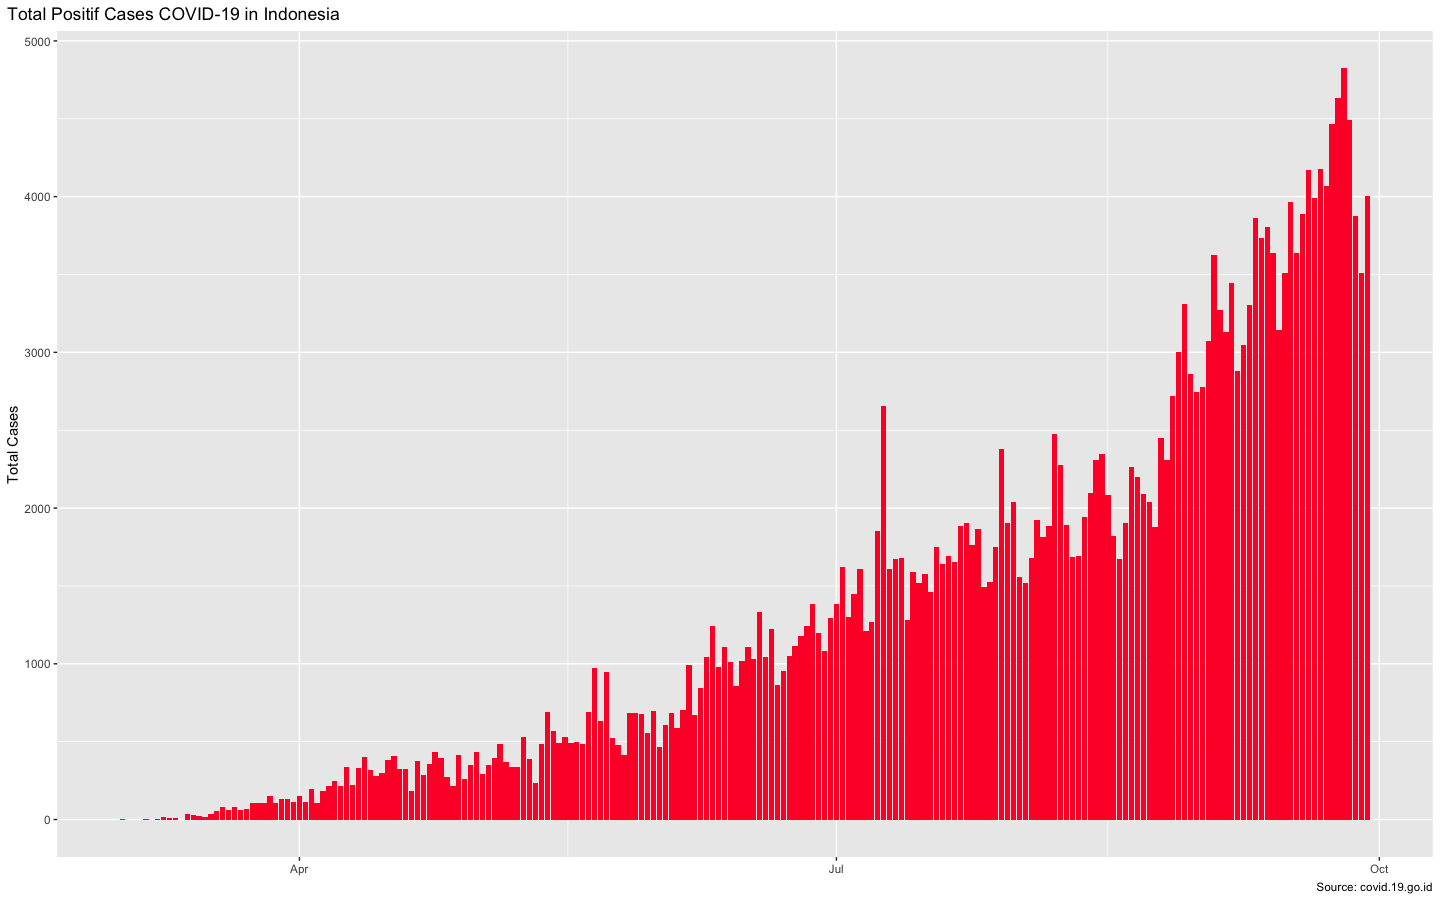
Exploratory Data and Visualization COVID-19 in Indonesia Using R Studio
Dig up covid19 in Indonesia timeseries data from one of the available open fires using R. Scraping data from API to analysis and visualisation.
Tools used :
R, httr, resp, ggplot2
Category :
Scraping, Timeseries, Statistics, EDA, Visualisation.
Sea Level Predictor
Analyzes a dataset of the global average sea-level change since 1880. This project use the data to predict the sea-level change through year 2050.
Tools used :
Python, Pandas, Matplotlib, Seaborn, Scipy.
Category :
Analysis, Visualisation, Regression.

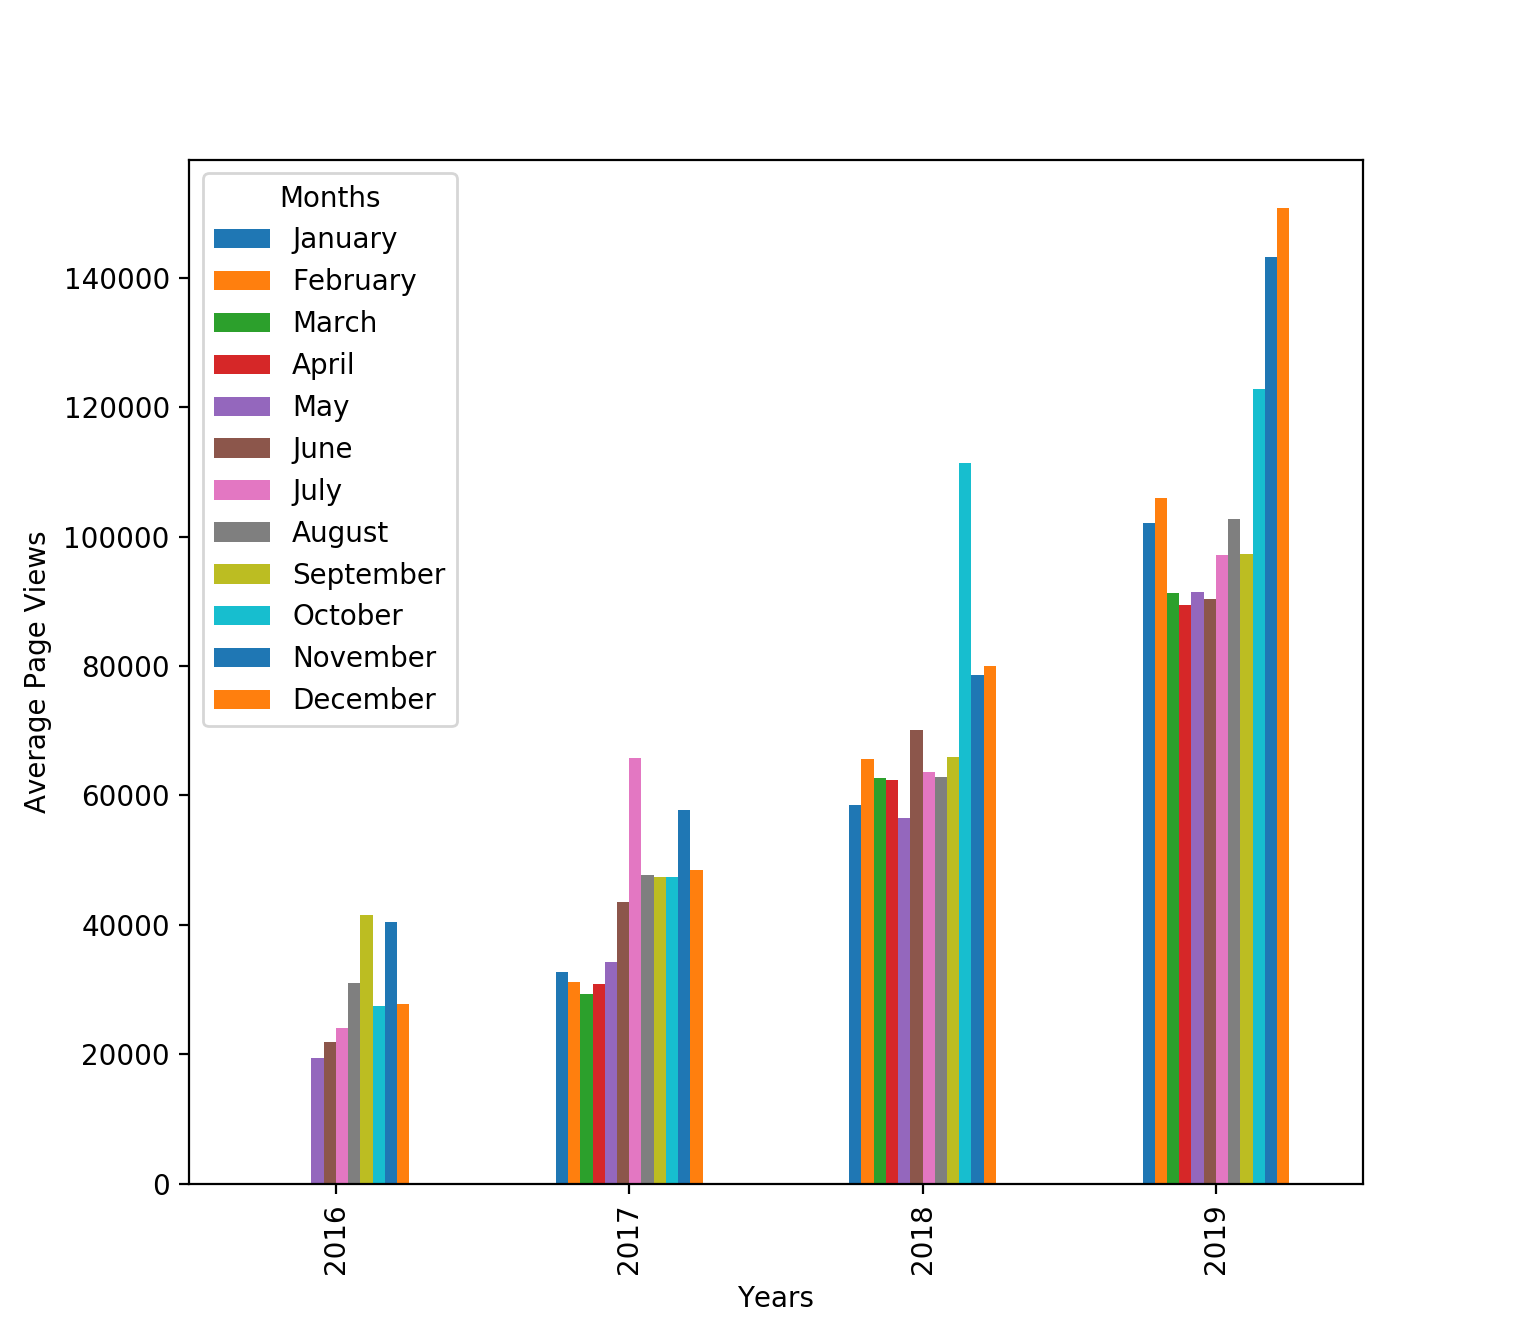
Page View Time Series Visualizer
This project visualizes time series data using a Line Chart, Bar Chart, and Box Plots.
Tools used :
Python, Pandas, Matplotlib, Seaborn.
Category :
Analysis, Visualisation.
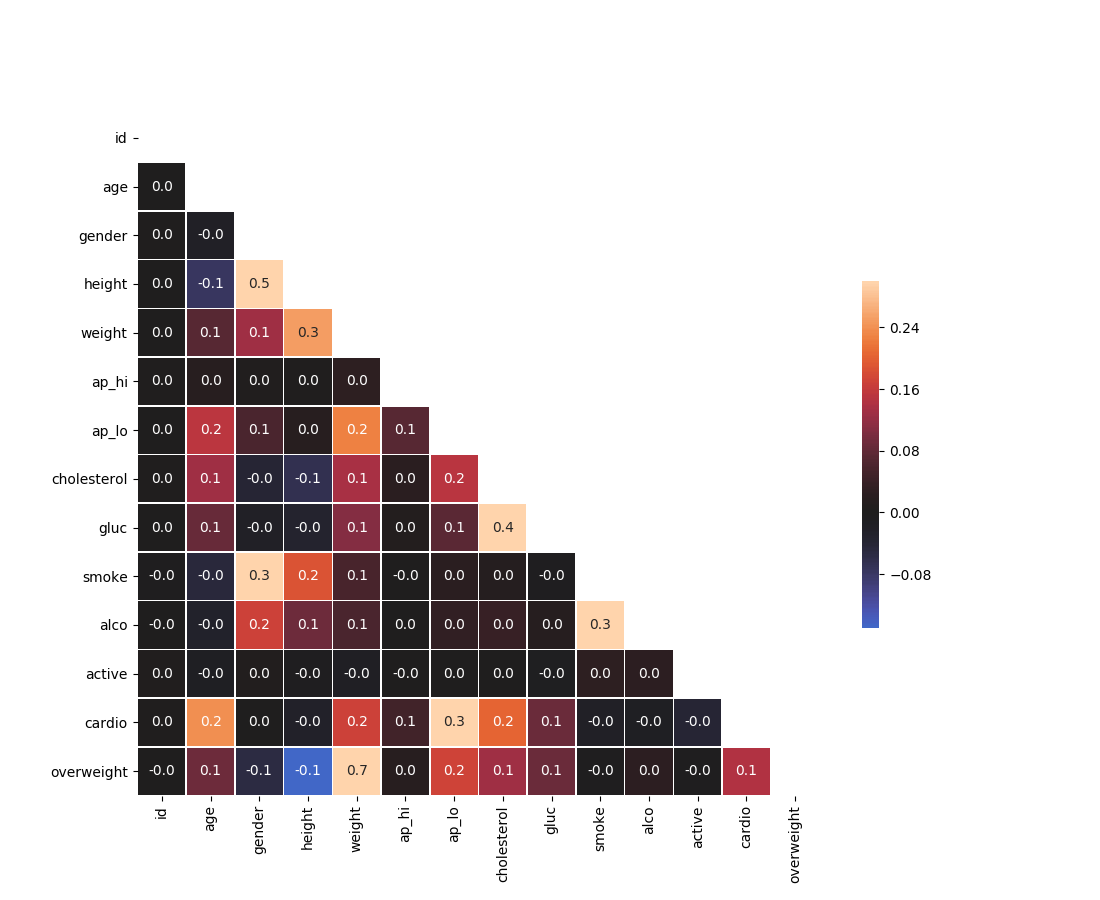
Medical Data Visualizer
Visualizes and make calculations from medical examination data using python visualizing tools. The dataset values were collected during medical examinations.
Tools used :
Python, Matplotlib, Seaborn, and Pandas.
Category :
Analysis, Visualisation, Statistics, Correlation.
Demographic Data Analyzer
Analyze demographic data using Pandas. The dataset of demographic data that was extracted from the 1994 Census database. The output to get demographic information.
Tools used :
Python, Pandas, Numpy.
Category :
Analysis, Statistics, EDA.
